DevOps API with Visual Studio Code

We recently had the need for one of our testing folks to be able to access DevOps API to get more information from DevOps Test Plans. He tried to get the information he was needing thru built in reports and even connecting Power BI to DevOps but still wasn’t able to get at what he needed. He discovered he could get the information he was after by using DevOps API and OData queries.

Problem was that he didn’t have the proper tools to call the API other than just Chrome browser. Normally our Integration developers will use Postman to connect, develop and test against API connections, but they do this using Azure Virtual Desktops. Our corporate machines are locked down (no local admin access) so users can’t install software on them. Our tester doesn’t have access to an Azure Virtual Desktop we we need to find another option.

Step 1: Find a client

I’m a big fan of Visual Studio Code (VSC) and was delighted to find out we could use it to test our Rest calls. The great thing about VSC is you do not have to have local admin rights to install it! Out of the box VSC does not have a rest client, but another great feature of VSC is all the extensions that you can install on it.

One of these extensions is Rest Client by Huachao Mao, the extension allows you to make HTTP requests and see the responses. It has almost a million downloads and 5 stars so you know it’s a good extension. It has really good documentation as well.

Step 2: Authentication

The rest client has a lot of different authentication options, so I first attempted to get it working with Azure Active Directory. But unfortunately when trying to connect I was getting the following error:
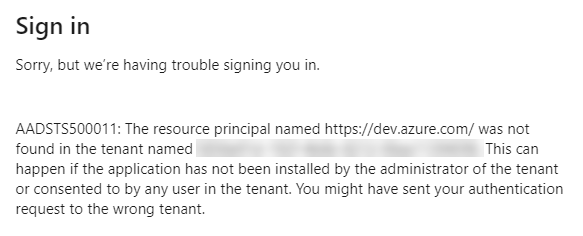
So we needed to have this endpoint added an an application in Azure Active Directory. I don’t have the proper permissions to do this at my company and wasn’t patient enough to get it created thru the proper channels. Luckily a colleague reminded me of Personal Access Tokens (PAT) in Azure DevOps. Personal Access Tokens allow you to create a token that you can then use use to connect to Azure DevOps.

Follow Microsoft’s documentation here to create a PAT:
https://docs.microsoft.com/en-us/azure/devops/organizations/accounts/use-personal-access-tokens-to-authenticate

Step 3: Send API Request

To create the request, Create New File in VSC and be sure to change the file type to “HTTP”.

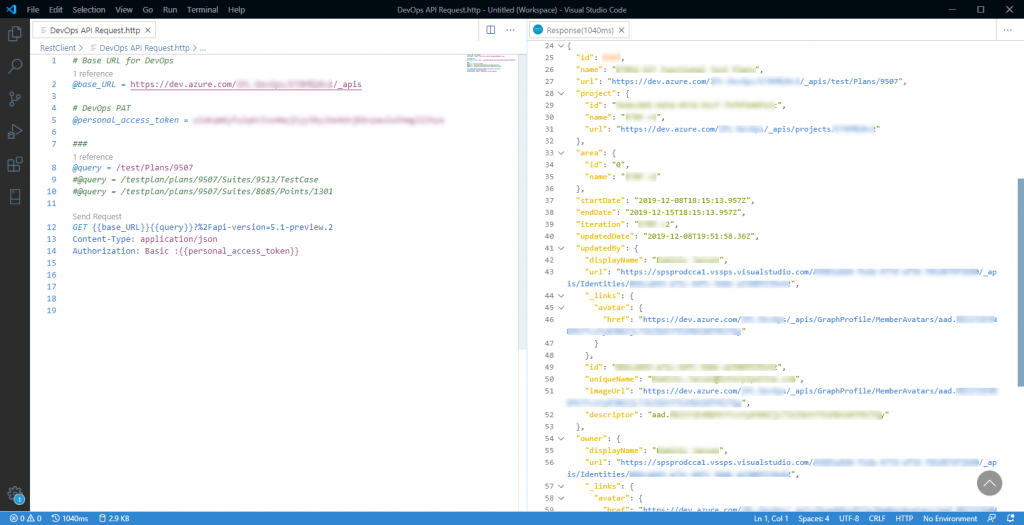
Here is the script we run to get a specific Test Plan via the API:

# Base URL for DevOps
@base_URL = https://dev.azure.com/<MyOrganization>/<MyProject>/_apis

# DevOps PAT
@personal_access_token = <Personal Access Token>

###
@query = /test/Plans/<Test Plan ID>

GET {{base_URL}}{{query}}?%2Fapi-version=5.1-preview.2
Content-Type: application/json
Authorization: Basic :{{personal_access_token}}

You will need to update this script with your Company ID, Project ID and the PAT you created in the previous step. As well in this query, this will return a Test Plan by the ID you specify.

When using the Rest Client, you will see a “Send Request” appear above our “GET” Verb.

After running the request, your response will open up on right side (or below based on your settings), with the results of your query.
Step 4: Send OData Request

Just like calling API’s like in Step 3, here is the script to make an OData Query.

# Base URL for DevOps
@apibase_URL = https://analytics.dev.azure.com/<MyOrganization>/<MyProject>/_odata/v3.0-preview/WorkItems

# DevOps PAT
@personal_access_token = <Personal Access Token>

###
#@query = ?<OData Query>
@query = ?$select=WorkItemId,Title,WorkItemType,State&$filter=WorkItemId eq 8594&$expand=Links($select=SourceWorkItemId,TargetWorkItemId,LinkTypeName;$filter=LinkTypeName eq 'Related';$expand=TargetWorkItem($select=WorkItemId,Title,State))

GET {{apibase_URL}}{{query}}
Content-Type: application/json
Authorization: Basic :{{personal_access_token}}

Conclusion

Hopefully this gives you a good sample of how you can use Visual Studio Code as a Rest Client to do some developing and testing against API’s. In particular in this case this shows you how to make API calls and OData queries against Azure DevOps Test Plans.

Let me know if this was helpful.

SAP to Logic App Error – “SEGMENT_UNKNOWN”

After working through our first issues with SAP that I talked about in my last blog post, we started to see that not all our outbound IDOCS where making it to our receiving Logic App.

When investigating we came across another issue, this time we saw errors on both the SAP side and Logic App side:

1. SAP errors in SM58

The RequestContext on the IReplyChannel was closed

SAP developer did find that we had errors in our SAP outbound queue (SM58 – Transactional RFC) and the Status Text on the outbound messages was “The RequestContext on the IReplyChannel was closed“.

2. Errors on On-Premise Data Gateway

Exception Details: SAP.Middleware.Connector.RfcAbapException: SEGMENT_UNKNOWN

This error shows up when you have enabled extended SAP logging on the On-Premise Data Gateway.

David Burg a Senior Software Engineer at Microsoft explains in this blog article how to turn on the extended logging.

The Fix

As we were investigating these errors we also noticed that the outbound IDOC that was working was a standard out of the box IDOC. We noticed that the IDOCS that were failing have SAP Extensions on them. If you haven’t heard of SAP IDOC extensions, they are a method to extend out of the box messages with custom fields/elements. You can read more about extensions here.

When you look up these errors, you start to get a lot of articles related to BizTalk Server integration with SAP. Having been a BizTalk Developer in the past I can recall having similar issues.

Kent Weare who has written many blog posts on integrating with SAP had written this blog post on integrating with SAP when you have extended IDOCS: https://kentweare.blogspot.com/2008/09/biztalk-sap-adapter-and-extended-sap.html In one of the comments he mentioned about ensuring IDOC Extensions are released.

So you have to work with your SAP Developer to ensure your IDOC extensions are released. If you are moving from SAP PI/PO like our situation, the IDOCS did not have to be released, so you could run into this situation.

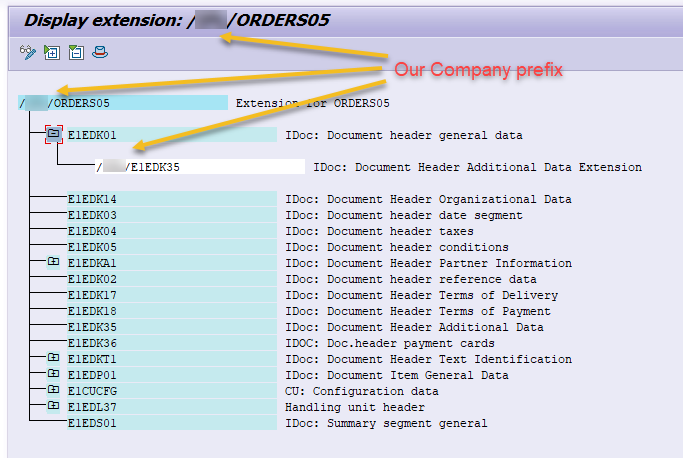
IDOC extensions are release using TCODE WE31 and you can find the segment names that are associated with the IDOC extension using TCODE WE30.

Here is the display extension screen for the standard ORDERS05 with our company extension:

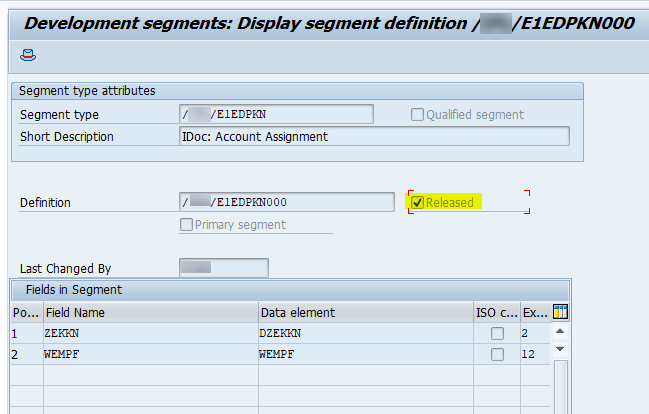
In TCODE WE31, your IDOC needs to have the “Released” field checked:

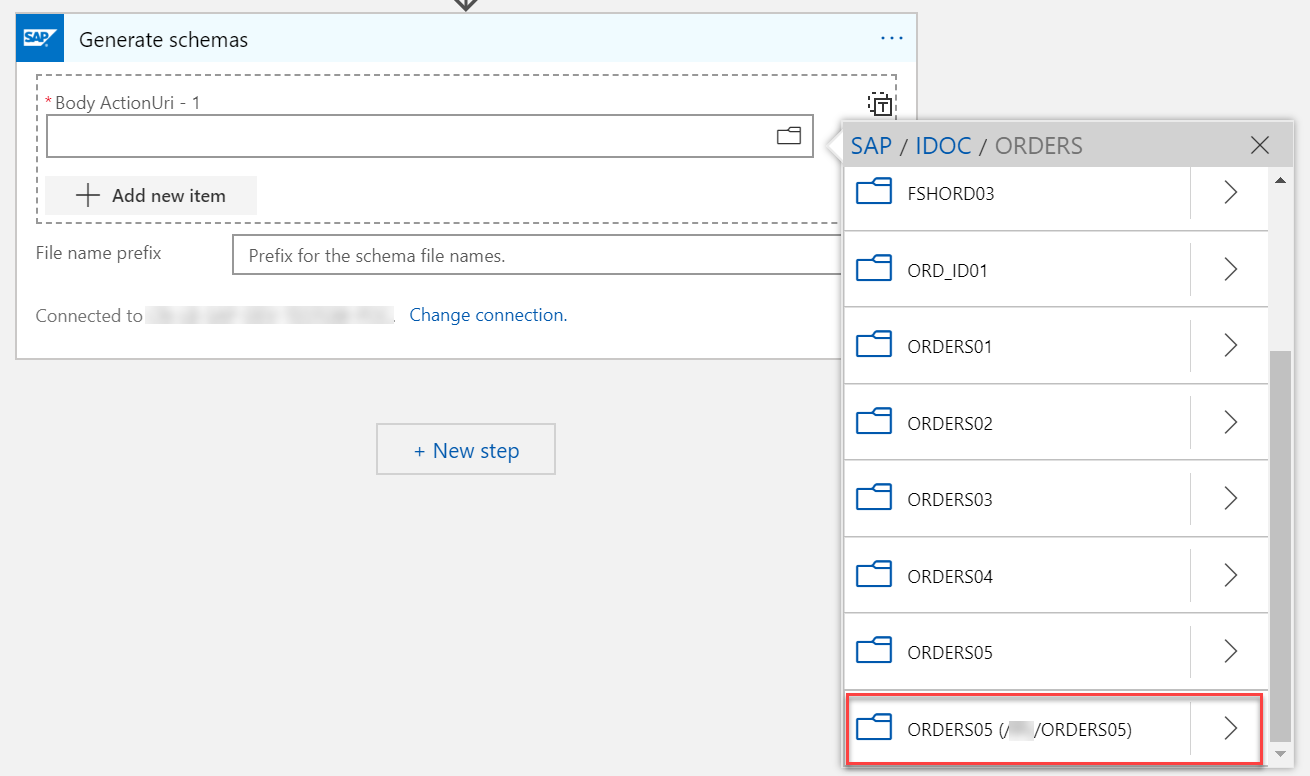
What this does then when using Logic Apps is it creates another IDOC in your list, with your company prefix.

Hope this helped you out if you ran into this issue. Please let me know if you found this article helpful and be sure to follow me on twitter.

SAP To Logic App Error – “no SAP ErrInfo available”

We have a project underway to integrate Logic Apps with SAP S4 Hana. We made good progress connecting to and sending messages to SAP, but ran into some issues when trying to get IDOC’s sent out from SAP to Logic Apps.

We have an Integrated Service Environment (ISE) that we run our Logic Apps thru, but unfortunately the SAP ISE connector has not been released as of yet (February 2020). Our only option at this time is to connect to our SAP environment using a On-Premise Data Gateway.

One day I hope to come back and write some posts with step-by-step instructions, but for now take a look at Microsoft’s SAP connector documentation for information on connecting your Logic Apps to SAP.

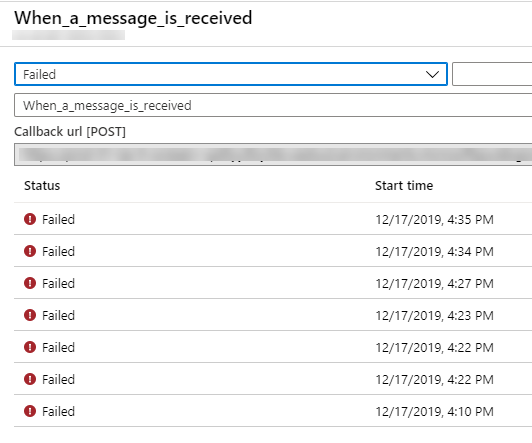
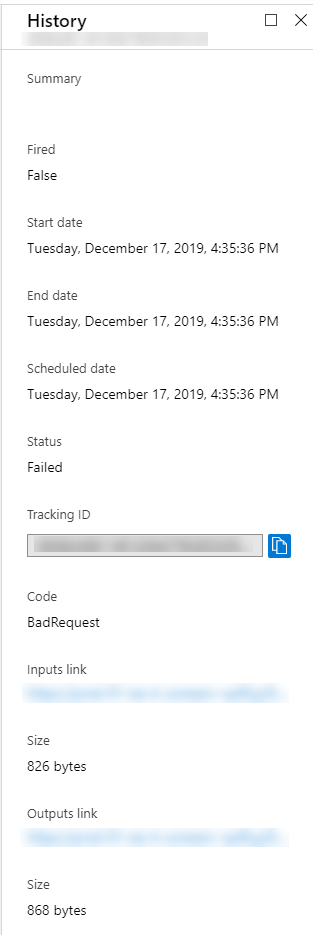
The issue we were experiencing would occur when we went to enable our trigger. After Enabling the Logic App, our Trigger History would show a “Failed” trigger status.

When clicking on the Failed Status, the History would show a Code of “BadRequest”.

Clicking on “Output Link” reveals the following error message:

Failed to process request. Error details: ‘no SAP ErrInfo available

"body": {
     "error": {
         "code": "GeneralBadRequest",
         "message": "Failed to process request. Error details: 'no SAP ErrInfo available\nRETURN CODE: 20'.",
         "target": "CommonAdapter"
     }
 }

And then subsequent runs would show the following trigger output:

"body": {
    "error": {
        "code": "GeneralBadRequest",
        "message": "Failed to process request. Error details: 'Cannot modify function handlers of server <Some Long ID> unless it is stopped (current state: Broken)'.",
        "target": "CommonAdapter"
    }
}

This GeneralBadRequest error continues to appear until you restart the On-Premise Data Gateway. At which point the first run reverts back to original error and subsequent runs back to this latest error.

Unfortunately these are very generic error messages that don’t provide much context as to what the actual issue is. So the solution below has helped us, but in your case it could be something else.

There is a way to enable extended SAP logging on the On-premise Data Gateway. David Burg is a Senior Software Engineer at Microsoft who has written a lot of different articles on SAP connectivity with Logic Apps. Half-way down this article David explains how to turn on the extended logging. Unfortunately this extended logging did not provide further details, as well as Microsoft Support was not able to narrow down our issue.

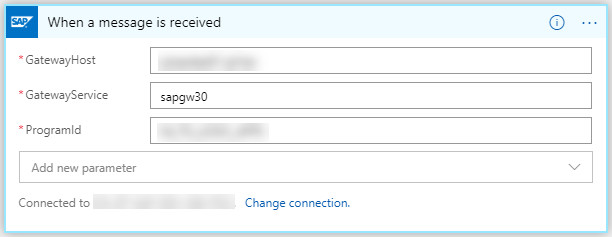
In the end, after many weeks of trying to troubleshoot we discovered what our issue was. During our configuration of our trigger, our BASIS team mentioned our System ID was 30 and that our Gateway Service was “sapgw30“.

During our troubleshooting we never received any error messages in regards to the Gateway Service, so nothing ever led us to believe “sapgw30” was invalid. Also coming from many years of BizTalk Development, this looks like a proper GatewayService.

Finally one of our consultants found the following SAP Community thread: https://answers.sap.com/questions/482451/sapncodll-rfc-server-connection-issues.html
The response in this article that finally gave us our fix?

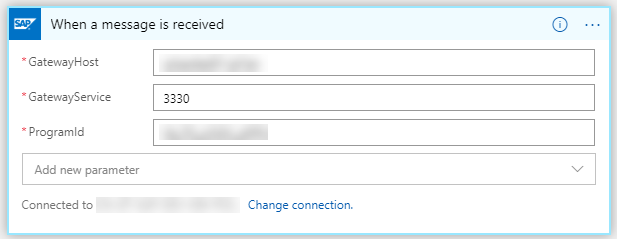
Instead of service name (sapgwnn) enter the port number of the ABAP gateway. The default gateway port number is 33nn, where nn is the instance number.

Once we updated our Logic App Trigger – GatewayService to “3330” everything started working as it should.

If this helps you out, please let me know in the comments section below. Also be sure to follow me on twitter.

Step by step guides, there has to be an easier way

Update January 2020: Stepshot.net has been purchased by UIPath.  You can read more about it here.

Have you ever had the painstaking task of creating a step by step guide?  You start with a word document, then you take a screen shot, you edit that screen shot, you paste into word.  Then you have to type a description of what to do “Click “Next” Button”.  Now we are ready for step two…  rinse and repeat!

I’ve been trying to get back to my blog for a while, but I’m also lazy with things I have to do over and over again.  Like many developers if I have to do something repetitive more that three times, I’ll find a way to write a script or write custom code to do it.  I’ve moved back to working on my home turf of Integration.  But now extending beyond BizTalk Server and into all the different PaaS, iPaaS and Serverless services inside Azure.  So I’ve got lots more coming on “Integrating the Cloud”

But back to this topic.  Some of you might remember the Windows utility called Problem Step Recorder (PSR)?  It was used with Windows 7, but most users did not even know it existed.   It’s seems like with so many good utilities that Microsoft has abandoned it,  I believe you can still run it on Windows 10, but doesn’t seem to be greatly improved.

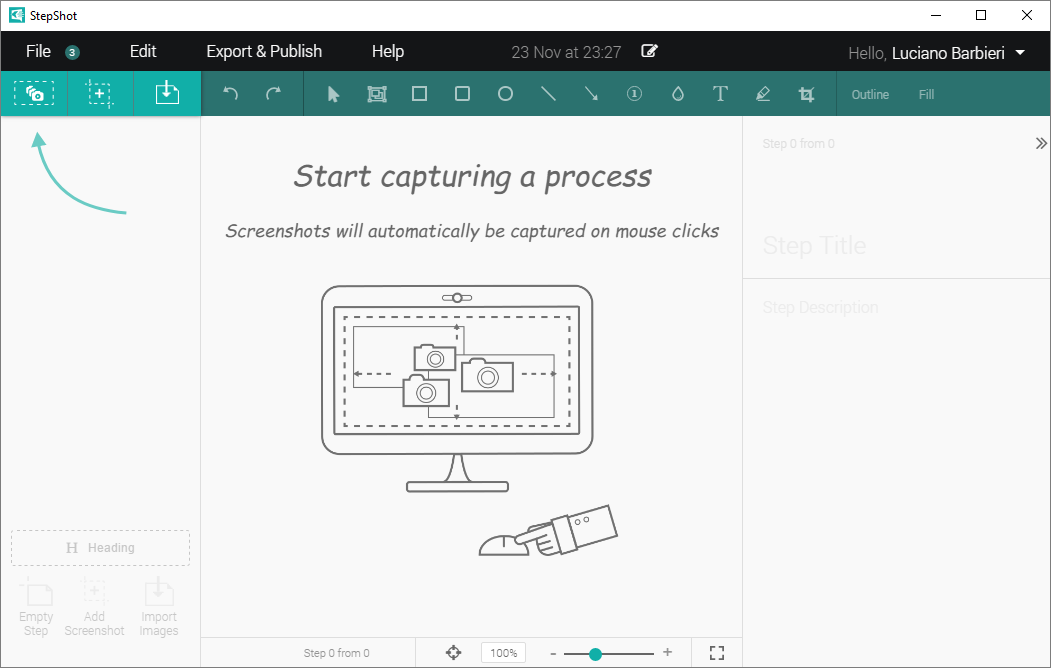
Anyways after a bit of research into different utilities out there I finally came across an awesome tool called StepShot Guides.   This tool is an advanced version of PSR and so much more.

It’s so easy, you just run the application on your desktop, and it takes a screenshot anytime you click, and captures the text at the same time.  In the background its automatically creating a document of what you are doing.  When done you click on stop and edit the steps and screenshots as required.

On Windows 10 if capturing screens with text off of a web browser its currently most accurate in IE11.  Chrome and Edge the text captured is more generic.  I have emailed the company and a lot better OCR capturing is coming soon.

Take a look over at stepshot.net